Gets estimates of P[Y = k | X = x] using a trained forest.
# S3 method for probability_forest
predict(
  object,
  newdata = NULL,
  num.threads = NULL,
  estimate.variance = FALSE,
  ...
)
Arguments
| object | The trained forest. |
|---|---|
| newdata | Points at which predictions should be made. If NULL, makes out-of-bag predictions on the training set instead (i.e., provides predictions at Xi using only trees that did not use the i-th training example). Note that this matrix should have the number of columns as the training matrix, and that the columns must appear in the same order. |
| num.threads | Number of threads used in prediction. If set to NULL, the software automatically selects an appropriate amount. |
| estimate.variance | Whether variance estimates for P[Y = k | X] are desired (for confidence intervals). |
| ... | Additional arguments (currently ignored). |
Value
A list with attributes `predictions`: a matrix of predictions for each class, and optionally the attribute `variance.estimates`: a matrix of variance estimates for each class.
Examples
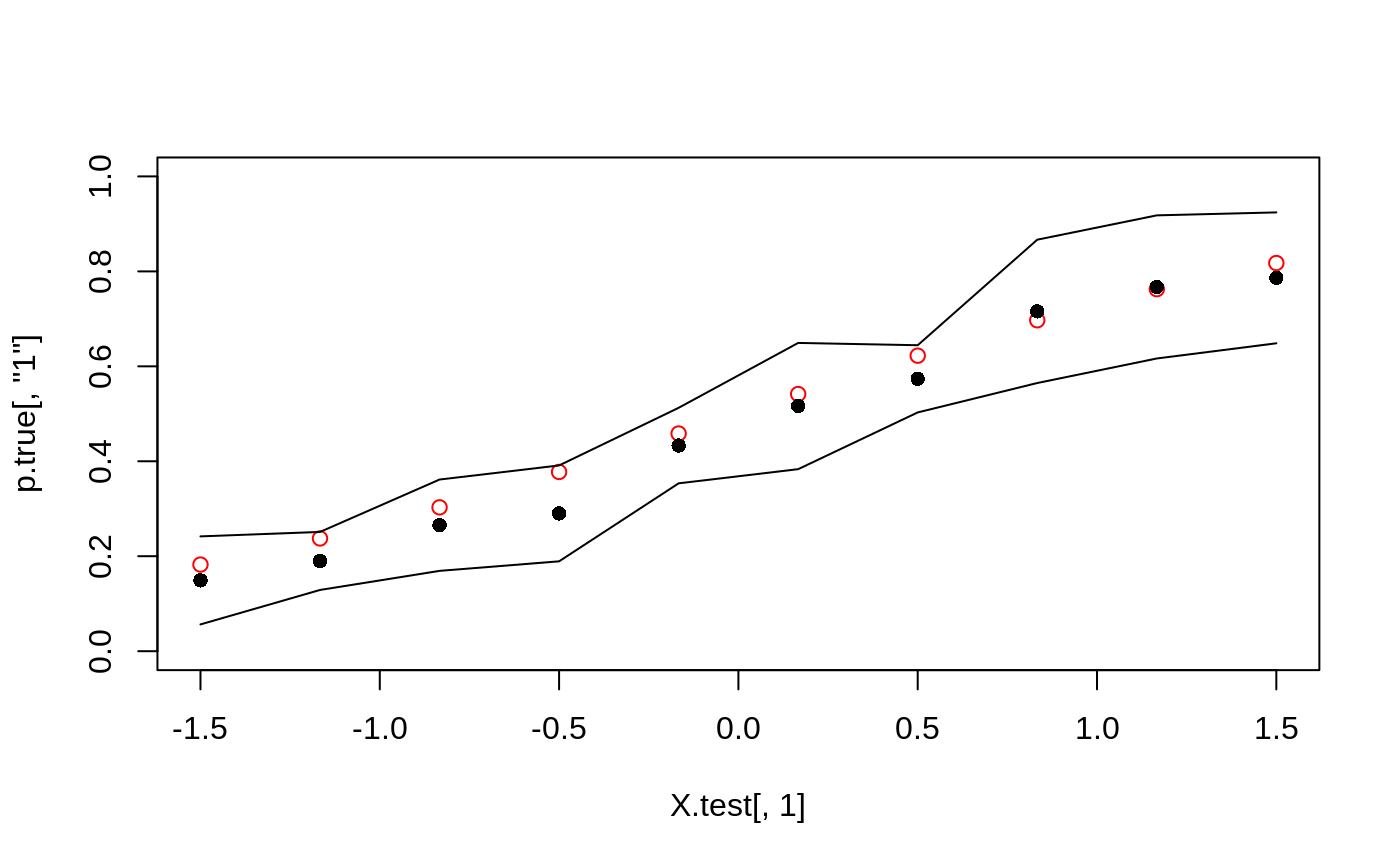
# \donttest{ # Train a probability forest. p <- 5 n <- 2000 X <- matrix(rnorm(n*p), n, p) prob <- 1 / (1 + exp(-X[, 1] - X[, 2])) Y <- as.factor(rbinom(n, 1, prob)) p.forest <- probability_forest(X, Y) # Predict using the forest. X.test <- matrix(0, 10, p) X.test[, 1] <- seq(-1.5, 1.5, length.out = 10) p.hat <- predict(p.forest, X.test, estimate.variance = TRUE) # Plot the estimated success probabilities with 95 % confidence bands. prob.test <- 1 / (1 + exp(-X.test[, 1] - X.test[, 2])) p.true <- cbind(`0` = 1 - prob.test, `1` = prob.test) plot(X.test[, 1], p.true[, "1"], col = 'red', ylim = c(0, 1))