Gets estimates of the conditional survival function S(t, x) = P[T > t | X = x] using a trained survival forest. The curve can be estimated by Kaplan-Meier, or Nelson-Aalen.
# S3 method for survival_forest
predict(
  object,
  newdata = NULL,
  failure.times = NULL,
  prediction.times = c("curve", "time"),
  prediction.type = c("Kaplan-Meier", "Nelson-Aalen"),
  num.threads = NULL,
  ...
)
Arguments
| object | The trained forest. |
|---|---|
| newdata | Points at which predictions should be made. If NULL, makes out-of-bag predictions on the training set instead (i.e., provides predictions at Xi using only trees that did not use the i-th training example). Note that this matrix should have the number of columns as the training matrix, and that the columns must appear in the same order. |
| failure.times | A vector of survival times to make predictions at. If NULL, then the failure times used for training the forest is used. If prediction.times = "curve" then the time points should be in increasing order. Default is NULL. |
| prediction.times | "curve" predicts the survival curve S(t, x) on grid t = failure.times for each sample Xi. "time" predicts S(t, x) at an event time t = failure.times[i] for each sample Xi. Default is "curve". |
| prediction.type | The type of estimate of the survival function, choices are "Kaplan-Meier" or "Nelson-Aalen". The default is the prediction.type used to train the forest. |
| num.threads | Number of threads used in prediction. If set to NULL, the software automatically selects an appropriate amount. |
| ... | Additional arguments (currently ignored). |
Value
A list with elements
predictions: a matrix of survival curves. If prediction.times = "curve" then each row is the survival curve for sample Xi: predictions[i, j] = S(failure.times[j], Xi). If prediction.times = "time" then each row is the survival curve at time point failure.times[i] for sample Xi: predictions[i, ] = S(failure.times[i], Xi).
failure.times: a vector of event times t for the survival curve.
Examples
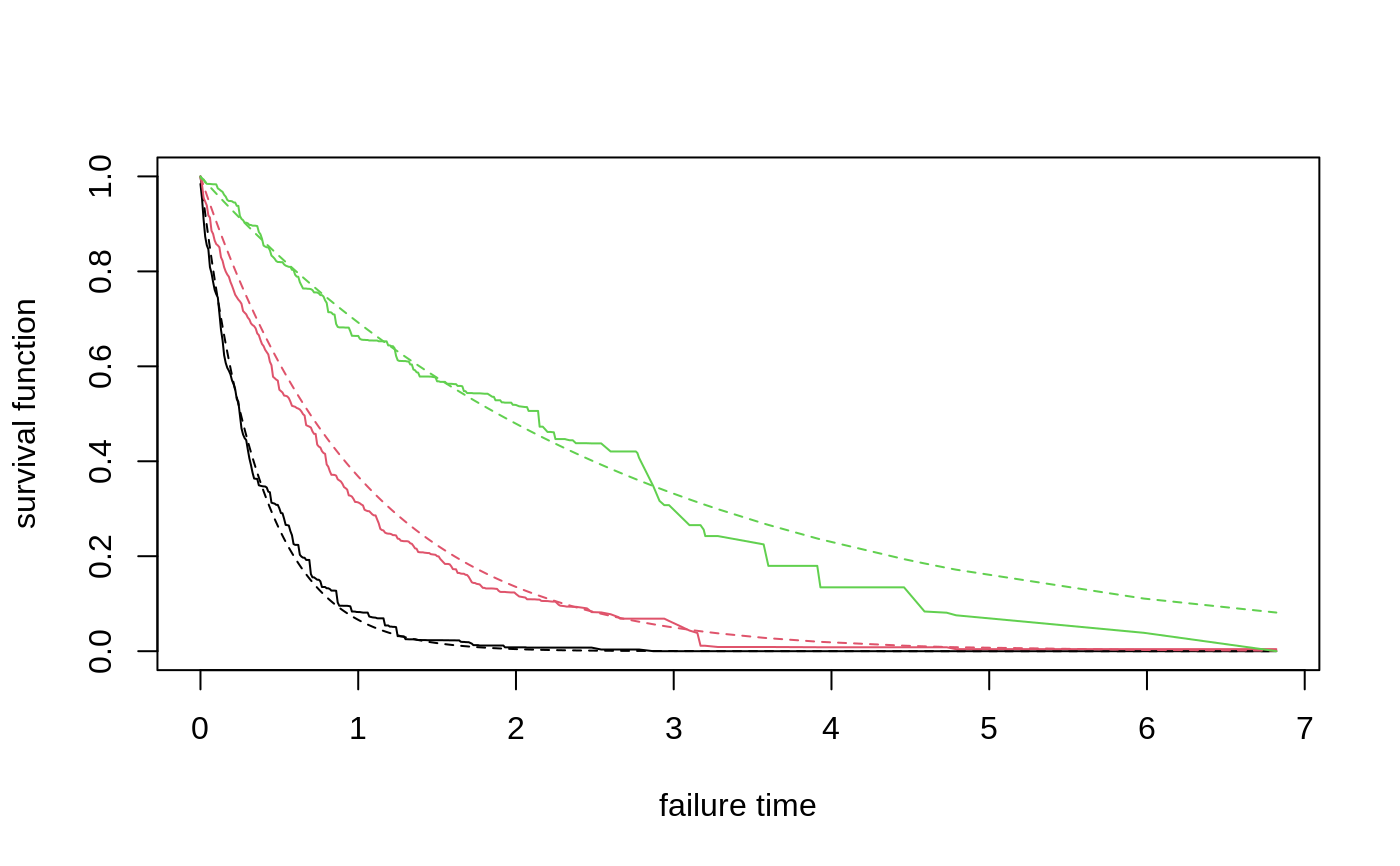
# \donttest{ # Train a standard survival forest. n <- 2000 p <- 5 X <- matrix(rnorm(n * p), n, p) failure.time <- exp(0.5 * X[, 1]) * rexp(n) censor.time <- 2 * rexp(n) Y <- pmin(failure.time, censor.time) D <- as.integer(failure.time <= censor.time) # Save computation time by constraining the event grid by discretizing (rounding) continuous events. s.forest <- survival_forest(X, round(Y, 2), D) # Or do so more flexibly by defining your own time grid using the failure.times argument. # grid <- seq(min(Y[D==1]), max(Y[D==1]), length.out = 150) # s.forest <- survival_forest(X, Y, D, failure.times = grid) # Predict using the forest. X.test <- matrix(0, 3, p) X.test[, 1] <- seq(-2, 2, length.out = 3) s.pred <- predict(s.forest, X.test) # Plot the survival curve. plot(NA, NA, xlab = "failure time", ylab = "survival function", xlim = range(s.pred$failure.times), ylim = c(0, 1))for(i in 1:3) { lines(s.pred$failure.times, s.pred$predictions[i,], col = i) s.true = exp(-s.pred$failure.times / exp(0.5 * X.test[i, 1])) lines(s.pred$failure.times, s.true, col = i, lty = 2) }# Predict on out-of-bag training samples. s.pred <- predict(s.forest) # Compute OOB concordance based on the mortality score in Ishwaran et al. (2008). s.pred.nelson.aalen <- predict(s.forest, prediction.type = "Nelson-Aalen") chf.score <- rowSums(-log(s.pred.nelson.aalen$predictions)) if (require("survival", quietly = TRUE)) { concordance(Surv(Y, D) ~ chf.score, reverse = TRUE) }#> Call: #> concordance.formula(object = Surv(Y, D) ~ chf.score, reverse = TRUE) #> #> n= 2000 #> Concordance= 0.6387 se= 0.008403 #> concordant discordant tied.x tied.y tied.xy #> 865347 489468 0 0 0# }